La population de La Ferrière-en-Parthenay a été estimée à 783 habitants en 2007. Vous trouverez ci-dessous un ensemble de graphiques courbes et statistiques du recensement de la population du village de La Ferrière-en-Parthenay.
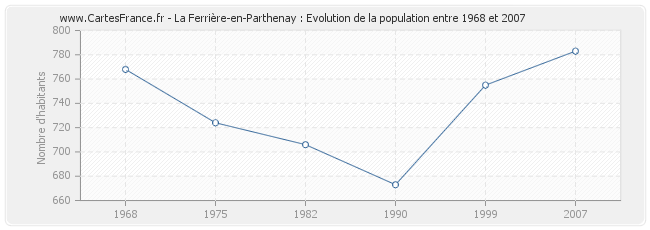
La population de La Ferrière-en-Parthenay était de 755 habitants en 1999, 673 habitants en 1990, 706 habitants en 1982, 724 habitants en 1975 et 768 habitants en 1968.
La Ferrière-en-Parthenay à une surperficie de 29,12 km², soit une densité de population de 26,89 habs/km².
Voir la population des villes et villages proches de La Ferrière-en-Parthenay :
- Population d'Oroux (79) situé à 4.33 km de La Ferrière-en-Parthenay
- Population de Chalandray (86) situé à 5.77 km de La Ferrière-en-Parthenay
- Population de La Peyratte (79) situé à 5.87 km de La Ferrière-en-Parthenay
- Population de Saurais (79) situé à 6.39 km de La Ferrière-en-Parthenay
- Population de Lhoumois (79) situé à 6.41 km de La Ferrière-en-Parthenay
Voir la population de la préfecture du département des Deux-Sèvres : Population Niort
Voir la population des autres villes des Deux-Sèvres : Deux-Sèvres
A voir aussi, les logements de La Ferrière-en-Parthenay, les photos de La Ferrière-en-Parthenay, le plan de La Ferrière-en-Parthenay.
J'aime La Ferrière-en-Parthenay !
Historique de la population de La Ferrière-en-Parthenay de 1968 à 2007
Historique de la population de La Ferrière-en-Parthenay de 1968 à 2007 :
La population de La Ferrière-en-Parthenay était de 783 habitants en 2007, 755 habitants en 1999, 673 habitants en 1990, 706 habitants en 1982, 724 habitants en 1975 et 768 habitants en 1968.
Ce recensement de la population du village de La Ferrière-en-Parthenay est sans doubles comptes.
Ce concept de population de La Ferrière-en-Parthenay sans doubles comptes signifie que chaque personne habitant La Ferrière-en-Parthenay et ayant des attaches dans un autre commune n'est prise en compte que pour l'une de ces deux communes.
Population La Ferrière-en-Parthenay
Répartition de la population de La Ferrière-en-Parthenay par sexe
Répartition de la population de La Ferrière-en-Parthenay par sexe :
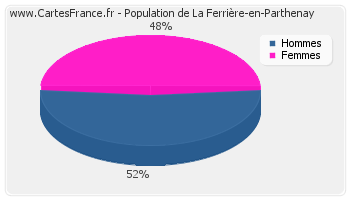
- Le nombre d'hommes habitant La Ferrière-en-Parthenay en 2007 était de 403
- Le nombre de femmes habitant La Ferrière-en-Parthenay en 2007 était de 379
- Le nombre d'hommes habitant La Ferrière-en-Parthenay en 2007 était de 403
- Le nombre de femmes habitant La Ferrière-en-Parthenay en 2007 était de 379

Evolution de la population de La Ferrière-en-Parthenay
Population de La Ferrière-en-Parthenay de 1968 à 2007 :
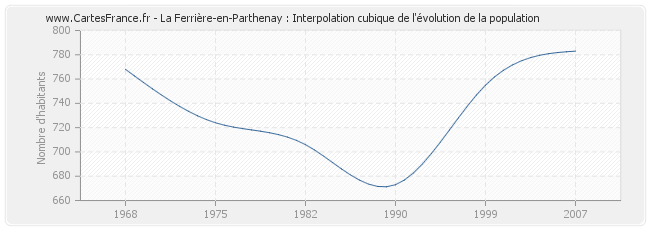
Cette courbe reprend l'historique de la population de La Ferrière-en-Parthenay de 1968 à 2007 en interpolation cubique. Ceci permet d'obtenir plus précisément la population de la commune de La Ferrière-en-Parthenay les années ou aucun recensement n'a été effectué.
- Population de La Ferrière-en-Parthenay en 2007 : 783 habitants
- Population de La Ferrière-en-Parthenay en 1999 : 755 habitants
- Population de La Ferrière-en-Parthenay en 1990 : 673 habitants
- Population de La Ferrière-en-Parthenay en 1982 : 706 habitants
- Population de La Ferrière-en-Parthenay en 1975 : 724 habitants
- Population de La Ferrière-en-Parthenay en 1968 : 768 habitants
La Ferrière-en-Parthenay : naissances et décès
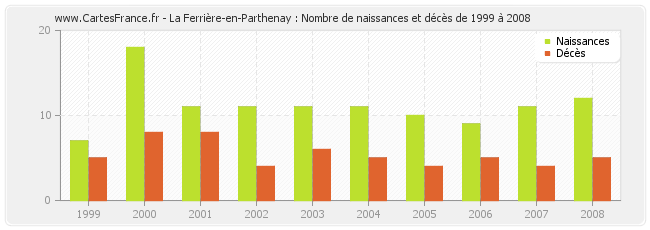
La Ferrière-en-Parthenay : naissances et décès de 1999 à 2008
- La Ferrière-en-Parthenay en 2008 : 12 naissances et 5 décès
- La Ferrière-en-Parthenay en 2007 : 11 naissances et 4 décès
- La Ferrière-en-Parthenay en 2006 : 9 naissances et 5 décès
- La Ferrière-en-Parthenay en 2005 : 10 naissances et 4 décès
- La Ferrière-en-Parthenay en 2004 : 11 naissances et 5 décès
- La Ferrière-en-Parthenay en 2003 : 11 naissances et 6 décès
- La Ferrière-en-Parthenay en 2002 : 11 naissances et 4 décès
- La Ferrière-en-Parthenay en 2001 : 11 naissances et 8 décès
- La Ferrière-en-Parthenay en 2000 : 18 naissances et 8 décès
- La Ferrière-en-Parthenay en 1999 : 7 naissances et 5 décès
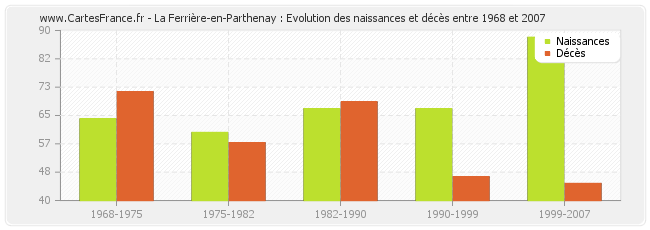
La Ferrière-en-Parthenay : évolution des naissances et décès de 1968 à 2007
- De 1999 à 2007 : 88 naissances et 45 décès
- De 1990 à 1999 : 67 naissances et 47 décès
- De 1982 à 1990 : 67 naissances et 69 décès
- De 1975 à 1982 : 60 naissances et 57 décès
- De 1968 à 1975 : 64 naissances et 72 décès
Répartition de la population de La Ferrière-en-Parthenay par âge
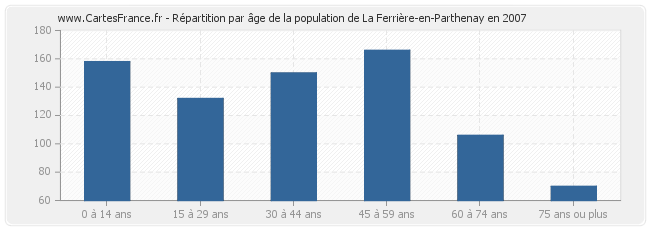
Répartition de la population de La Ferrière-en-Parthenay par âge en 2007 :
- Population de La Ferrière-en-Parthenay de 0 à 14 ans : 158 habitants
- Population de La Ferrière-en-Parthenay de 15 à 29 ans : 132 habitants
- Population de La Ferrière-en-Parthenay de 30 à 44 ans : 150 habitants
- Population de La Ferrière-en-Parthenay de 45 à 59 ans : 166 habitants
- Population de La Ferrière-en-Parthenay de 60 à 74 ans : 106 habitants
- Population de La Ferrière-en-Parthenay de 75 ans ou plus : 70 habitants
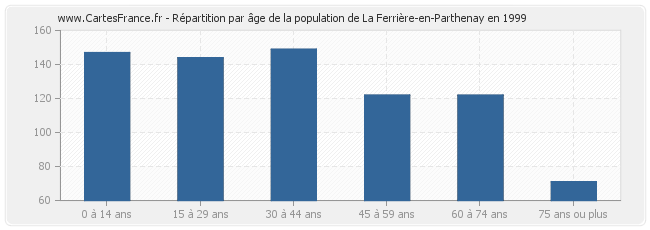
Répartition de la population de La Ferrière-en-Parthenay par âge en 1999 :
- Population de La Ferrière-en-Parthenay de 0 à 14 ans : 147 habitants
- Population de La Ferrière-en-Parthenay de 15 à 29 ans : 144 habitants
- Population de La Ferrière-en-Parthenay de 30 à 44 ans : 149 habitants
- Population de La Ferrière-en-Parthenay de 45 à 59 ans : 122 habitants
- Population de La Ferrière-en-Parthenay de 60 à 74 ans : 122 habitants
- Population de La Ferrière-en-Parthenay de 75 ans ou plus : 71 habitants
Population masculine de La Ferrière-en-Parthenay en 2007
Répartition de la population masculine de La Ferrière-en-Parthenay par âge en 2007 :
- Hommes de 0 à 14 ans habitant La Ferrière-en-Parthenay : 86
- Hommes de 15 à 29 ans habitant La Ferrière-en-Parthenay : 69
- Hommes de 30 à 44 ans habitant La Ferrière-en-Parthenay : 76
- Hommes de 45 à 59 ans habitant La Ferrière-en-Parthenay : 86
- Hommes de 60 à 74 ans habitant La Ferrière-en-Parthenay : 53
- Hommes de 75 à 90 ans habitant La Ferrière-en-Parthenay : 34
- Hommes de 90 ans ou plus habitant La Ferrière-en-Parthenay : 1
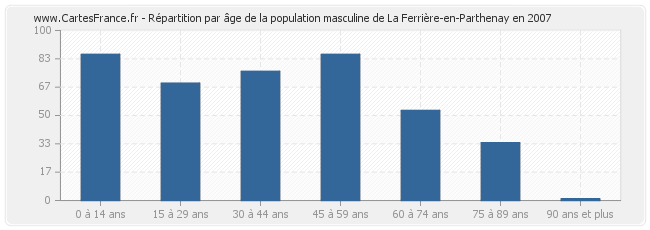
Répartition de la population masculine de La Ferrière-en-Parthenay par âge en 2007 :
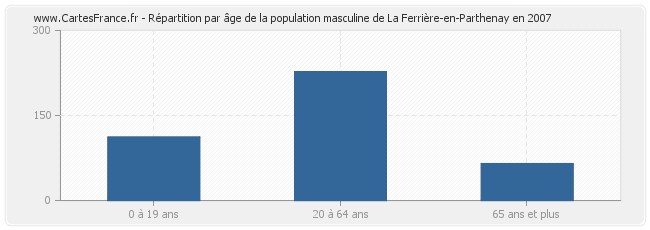
- Hommes de 0 à 19 ans habitant La Ferrière-en-Parthenay : 112
- Hommes de 20 à 64 ans habitant La Ferrière-en-Parthenay : 227
- Hommes de 65 ans et plus habitant La Ferrière-en-Parthenay : 65
Population féminine de La Ferrière-en-Parthenay en 2007
Répartition de la population féminine de La Ferrière-en-Parthenay par âge en 2007 :
- Femmes de 0 à 14 ans habitant La Ferrière-en-Parthenay : 73
- Femmes de 15 à 29 ans habitant La Ferrière-en-Parthenay : 64
- Femmes de 30 à 44 ans habitant La Ferrière-en-Parthenay : 75
- Femmes de 45 à 59 ans habitant La Ferrière-en-Parthenay : 81
- Femmes de 60 à 74 ans habitant La Ferrière-en-Parthenay : 53
- Femmes de 75 à 90 ans habitant La Ferrière-en-Parthenay : 35
- Femmes de 90 ans ou plus habitant La Ferrière-en-Parthenay : 0
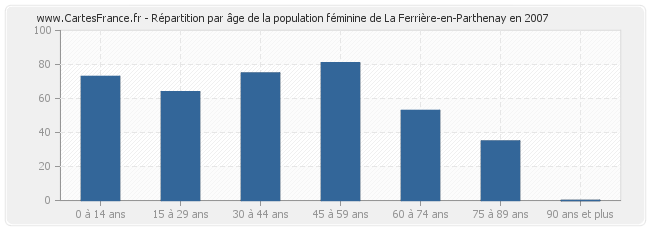
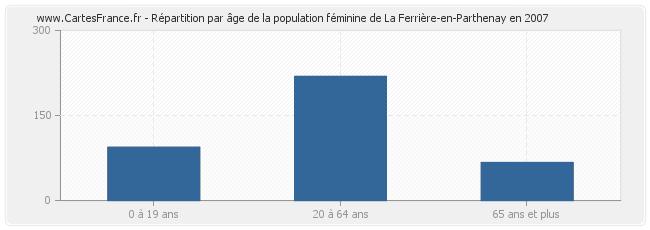
Répartition de la population féminine de La Ferrière-en-Parthenay par âge en 2007 :
- Femmes de 0 à 19 ans habitant La Ferrière-en-Parthenay : 94
- Femmes de 20 à 64 ans habitant La Ferrière-en-Parthenay : 219
- Femmes de 65 ans et plus habitant La Ferrière-en-Parthenay : 67
